NPS Analytics
Learn more about NPS analytics and the dashboard that will show you detailed quantitative and qualitative feedback on all the responses with your selected date range and segment.

Written by Sofia Domingues
Updated at June 11th, 2025
NPS Dashboard
NPS responses are added to the Appcues NPS dashboard in real-time.
Score responses are then divided into three groups:
- Promoters (9-10)
- Neutrals (7-8)
- Detractors (0-6)
Your NPS score is calculated as the % of respondents who are Promoters — the % of respondents who are Detractors.
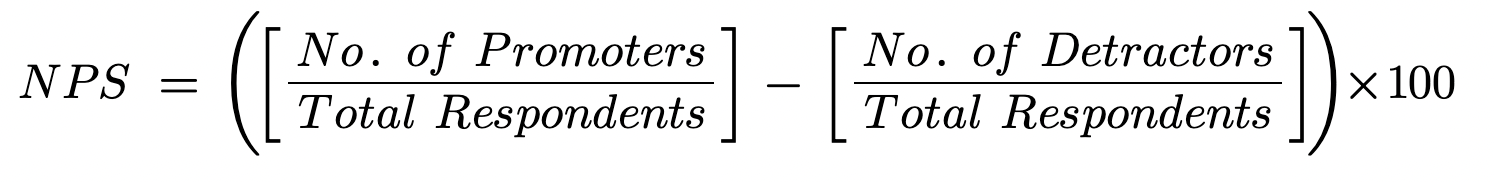
For example, if you have 1,200 people respond to your NPS survey and 400 are promoters and 200 are detractors, your NPS score would be 17. [(400/1,200) - (200/1,200)] * 100
A Net Promoter Score can range from -100 (100% detractors) to 100 (100% promoters). Appcues calculates your NPS score automatically for responses over the trailing 30 days.
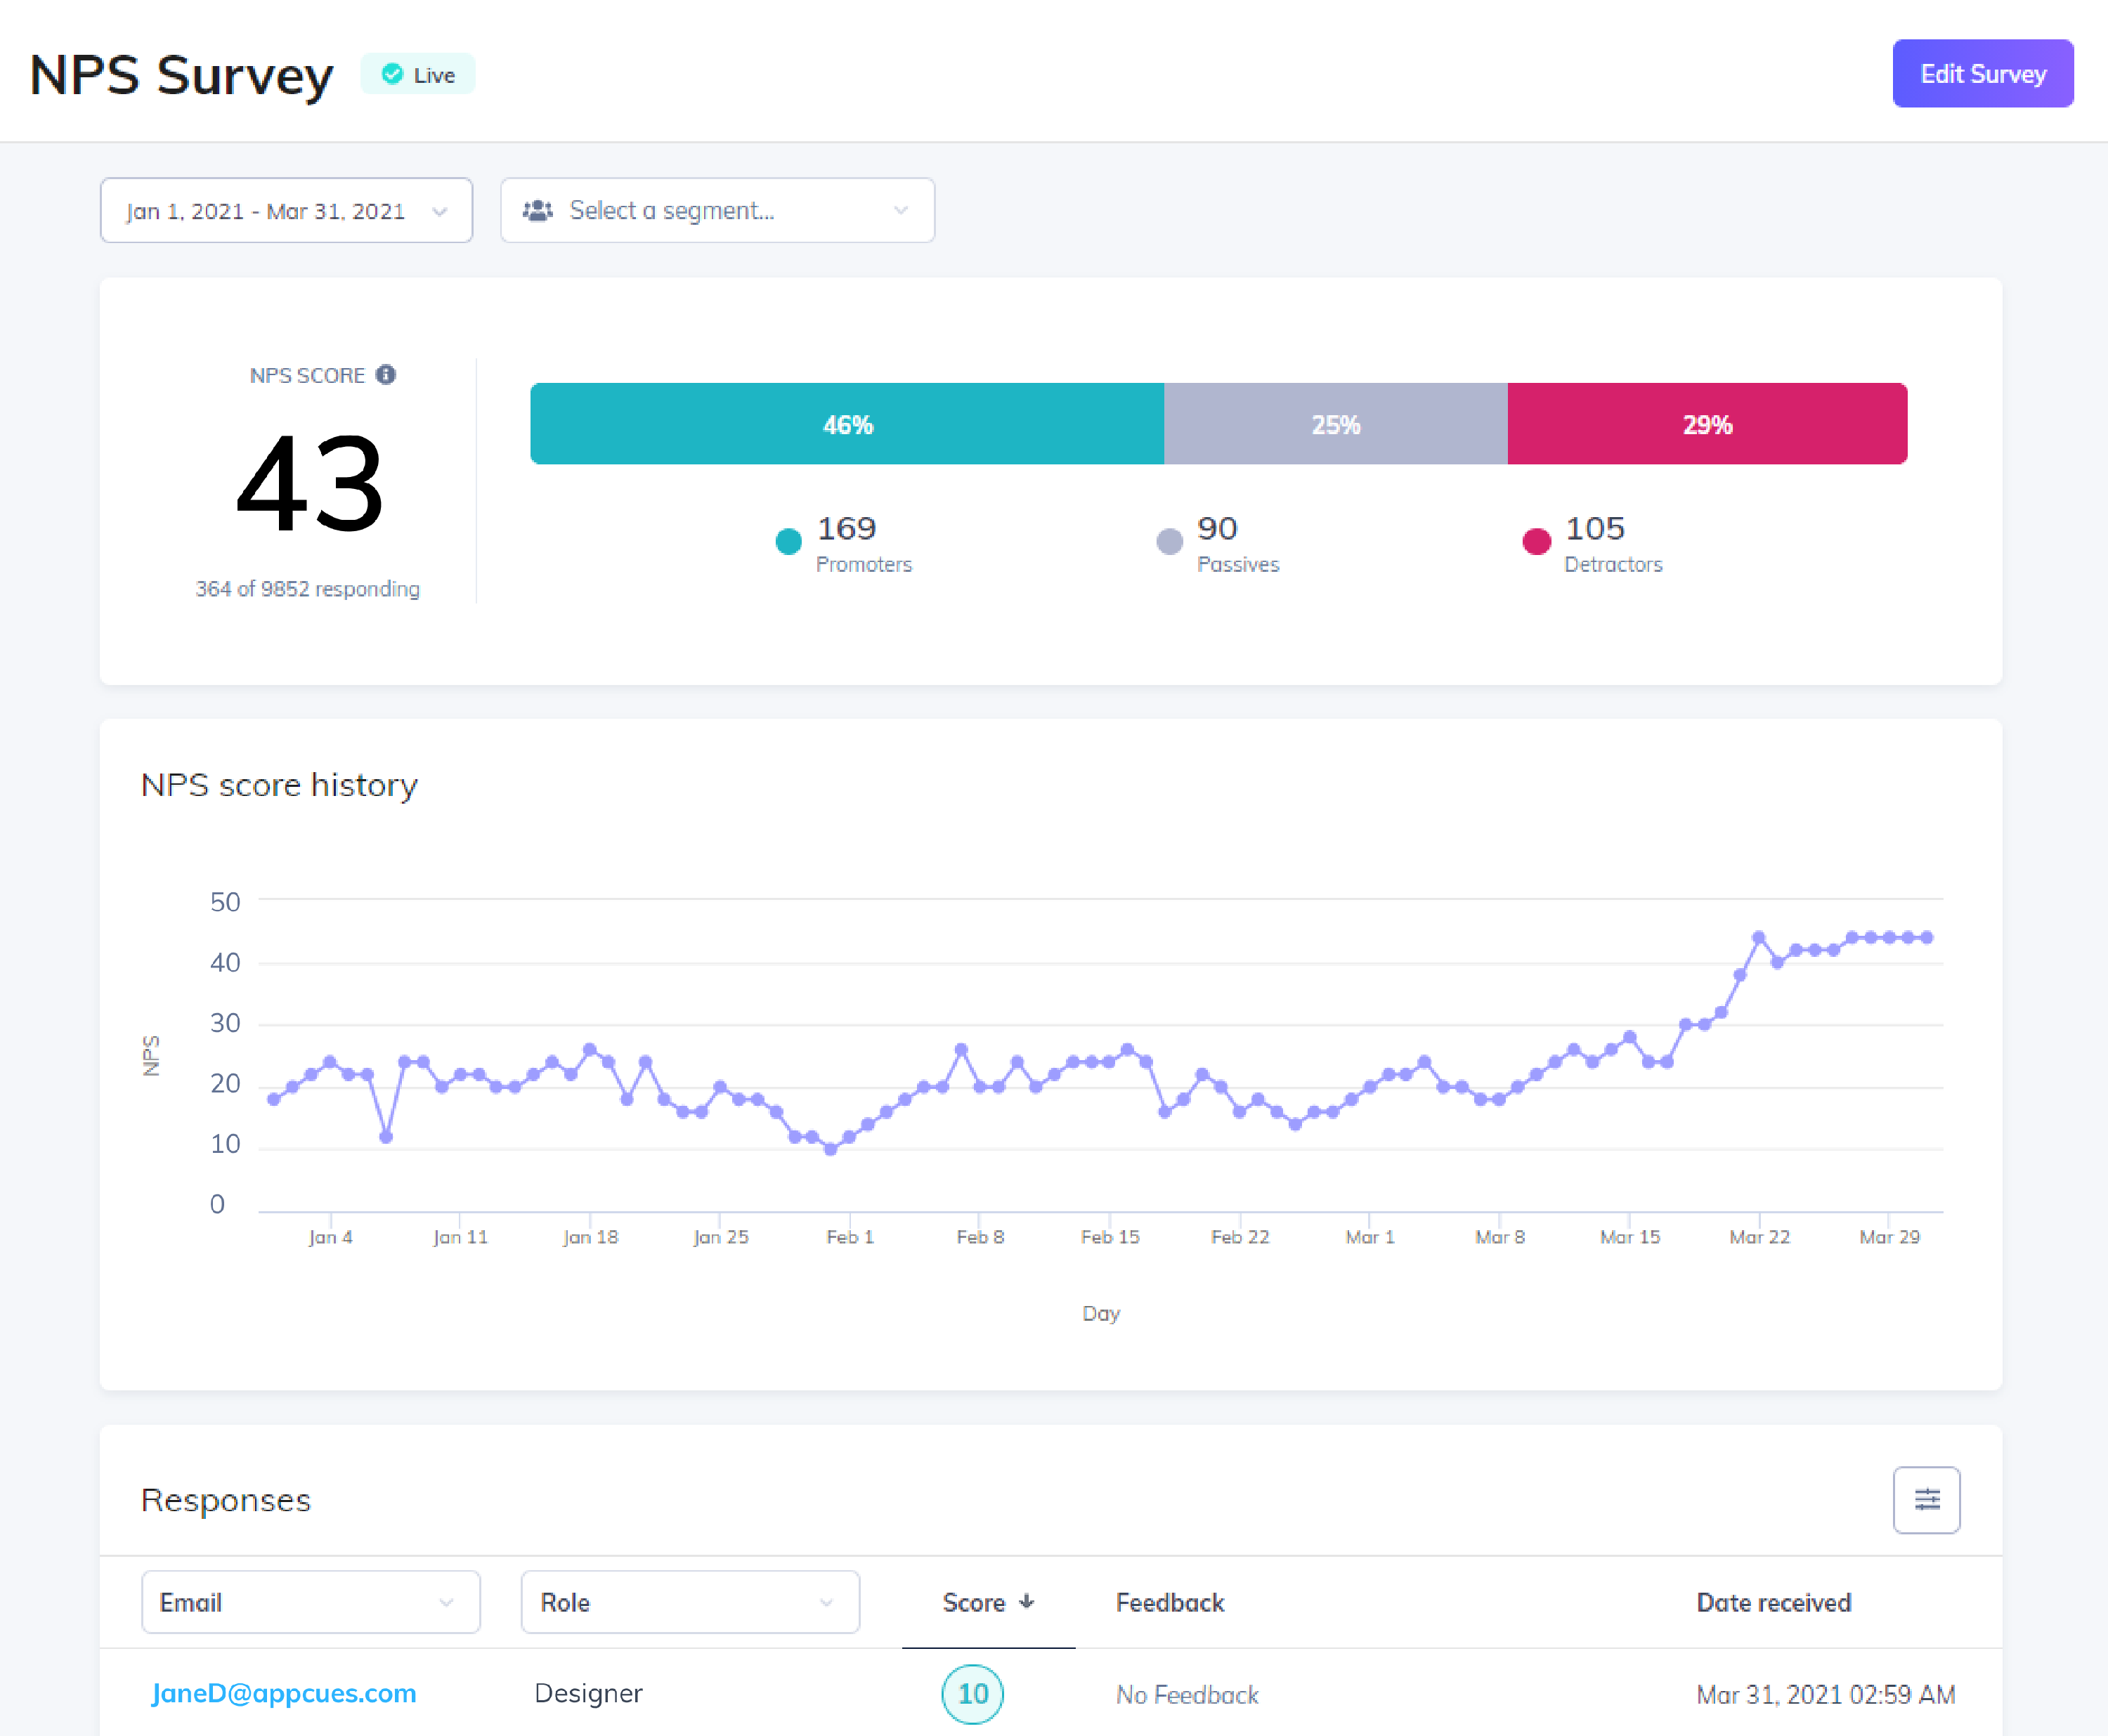
The Appcues NPS dashboard will also show you detailed quantitative and qualitative feedback on all the responses with your selected date range and segment. If any user provides multiple NPS scores during the 30 day period (including if they update their score before submitting feedback), we use their most recent score in our calculation.
The NPS Score tile reports on the current Score and the total number of users that responded to the NPS out of the total times the NPS was shown. In the example above (364 of 9852 responding) that would mean 364 users responded to the NPS out of the 9852 total times the NPS was shown.
Note: If someone submits 2 responses within your selected date range, they will only be reflected once within the total respondents at the top of the page, but you will see both of their responses in the responses table below. For example, you may see 98 responded, but 100 responses; 2 people in your date range were able to fill out the survey twice.
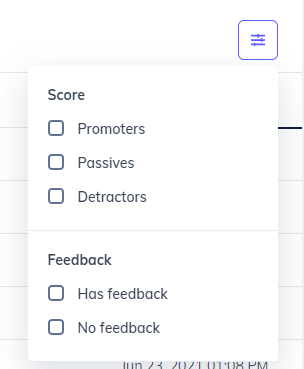
The filter options allow you to view specific responses.
Exporting NPS Survey Data
There are 2 ways to export NPS data:
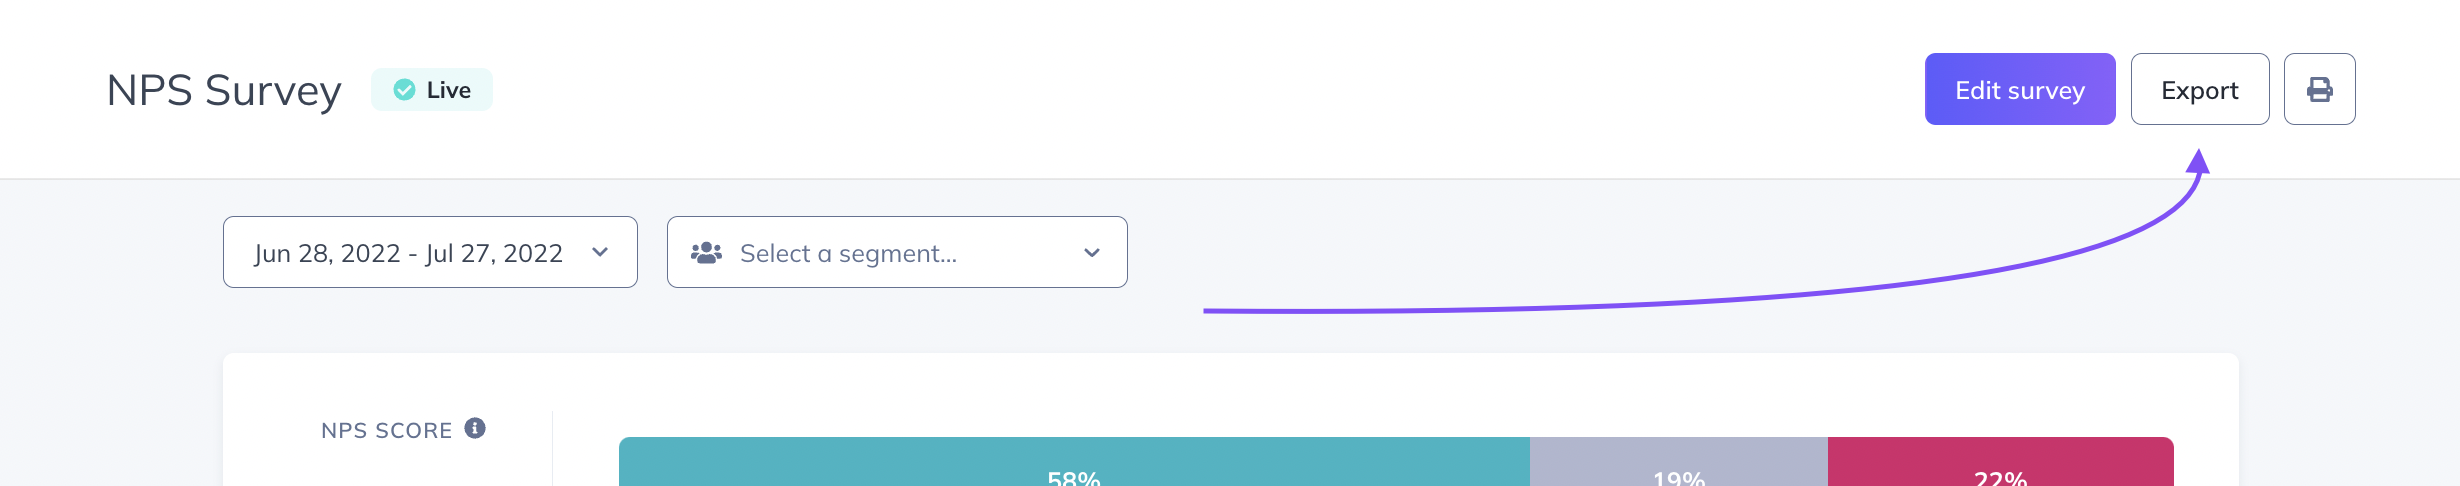
1. In Studio:
You can export your NPS data by clicking the Export button on the right side of the NPS Survey page. The export option will allow you to select a specific date range.
The Studio Export will generate a CSV to your email that looks like this:
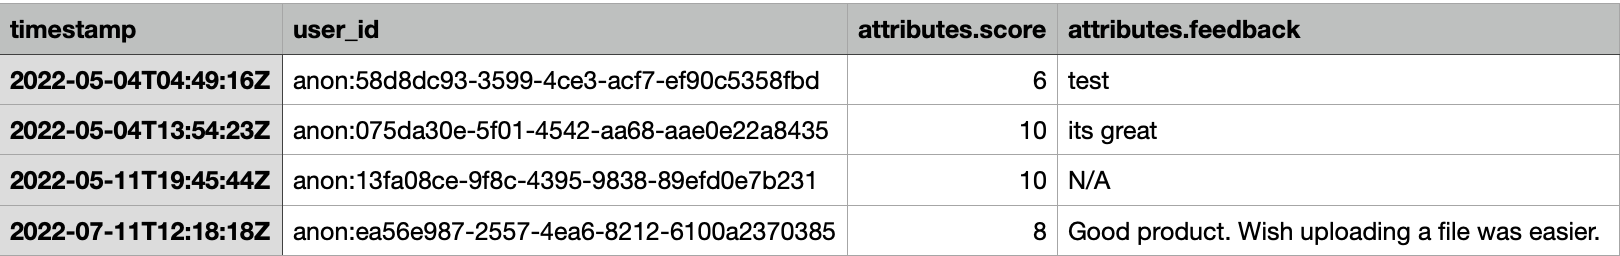
The attributes.score column will reflect their NPS score; and the attributes.feedback column will reflect their feedback submission if entered.
2. Using the Public API
Exporting using the Public API will allow you to access all the events associated with the NPS, including when it was shown or dismissed. Here are the descriptions of these events and the properties associated:
NPS Events and Properties
After you start collecting feedback from customers, you can build reports outside of Appcues using our CSV exports or an integration.
Here is a summary of the event names you may find:
| Event Name | Event Description |
|---|---|
| nps_survey_started | A user has seen the NPS survey |
| nps_score | A user submitted an NPS score. |
| nps_feedback | A user submitted NPS feedback after selecting an NPS score. |
| nps_ask_me_later_selected_at | A user selected the "Ask Me Later" button at the given timestamp property on an NPS survey that was shown to them |
| nps_clicked_update_nps_score | A user that has already submitted an NPS score selected the "Update Score" option and potentially changed their NPS score. |
Each of these events will have default properties as well as additional properties related to the event.
Default Properties
| Property Name | Property Description |
|---|---|
| timestamp | the time at which this event occurred |
| userId | the user that completed the event |
| currentPageTitle | the title of the page the user was on when the event was completed |
| currentPageUrl | the url of the page the user was on when the event was completed |
| sessionPageviews | the number of pages the user visited in the session in which the event was completed |
Event Specific Properties
| Event Name | Event Properties |
|---|---|
| nps_survey_started | default properties (see above) |
| nps_score | score- the score that the user selected, default properties (see above) |
| nps_feedback | feedback- the qualitative feedback the user provided, default properties (see above) |
| nps_ask_me_later_selected_at | askMeLaterSelectedAt- the timestamp at which the user selected "Ask Me Later", default properties (see above) |
| nps_clicked_update_nps_score | score- the new score that the user selected, default properties (see above) |
Calculating NPS Score from the Public API Export
Your CSV export will contain all of the events for your users who viewed and took your NPS Survey. When you analyze your results to calculate your NPS Score, there are a few things to keep in mind for your calculations.
Surveys Shown versus Survey Response
The nps_survey_started event indicates that the user was shown an NPS Survey, and does not necessarily indicate that they responded to it. For your calculations, you will want to use the nps_score event to count up your total NPS respondents.
Users with Multiple Scores
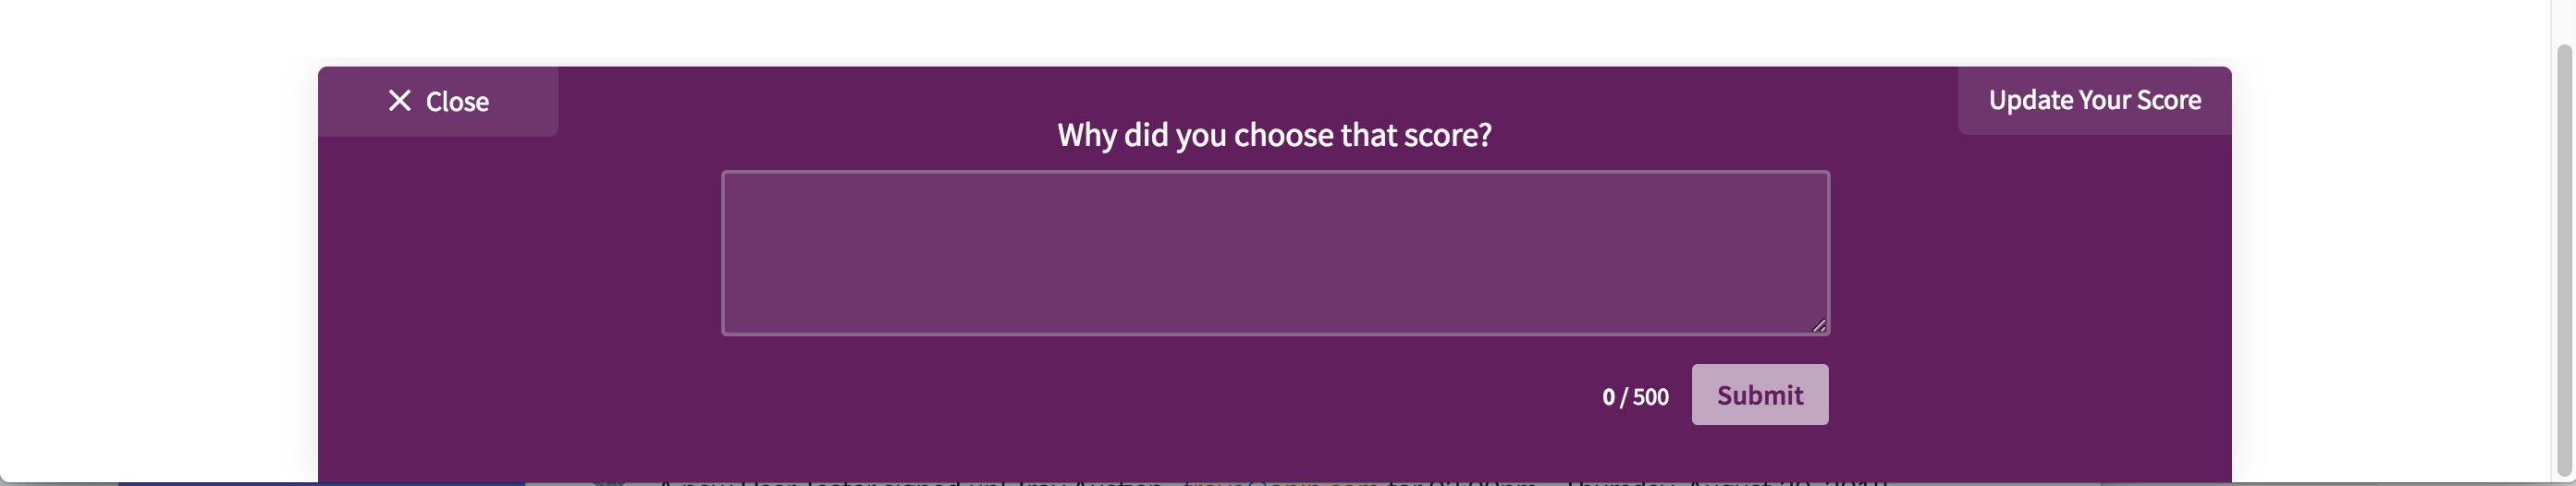
Users may choose to update their score with the "Update Your Score" option, which takes them back to the score submission form. When users submit multiple scores, you will want to use their most recent score in your calculations for the total bucket counts for detractors and promoters.
Users Over Multiple Survey Cycles
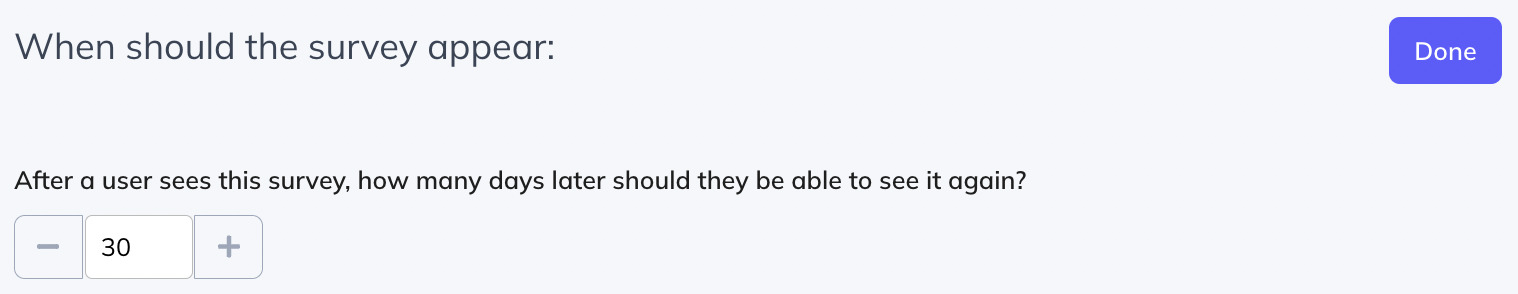
If your CSV export spans a timeframe that is greater than your survey's cycle, you will want to count your users' scores for each survey cycle if they were given the survey multiple times. For example, if your survey is shown once every 30 days and your CSV export spans 90 days, there may be users who have taken the survey up to 3 times.
Their scores should be counted once per survey cycle in order to ensure that you are capturing the overall sentiment of users over that 90 day period.