Flow Analytics Overview
Learn more about your Flow events over time and gain insights into the performance, engagement and success of your Flows.

Written by Sofia Domingues
Updated at June 11th, 2025
Intro to Flow Analytics
With Appcues' Flow Analytics page, you can see your key flow events over time, by date, in your local time zone. This will give you better insights into the performance, engagement and success of your flows so that you can drive your product to further success with Appcues!
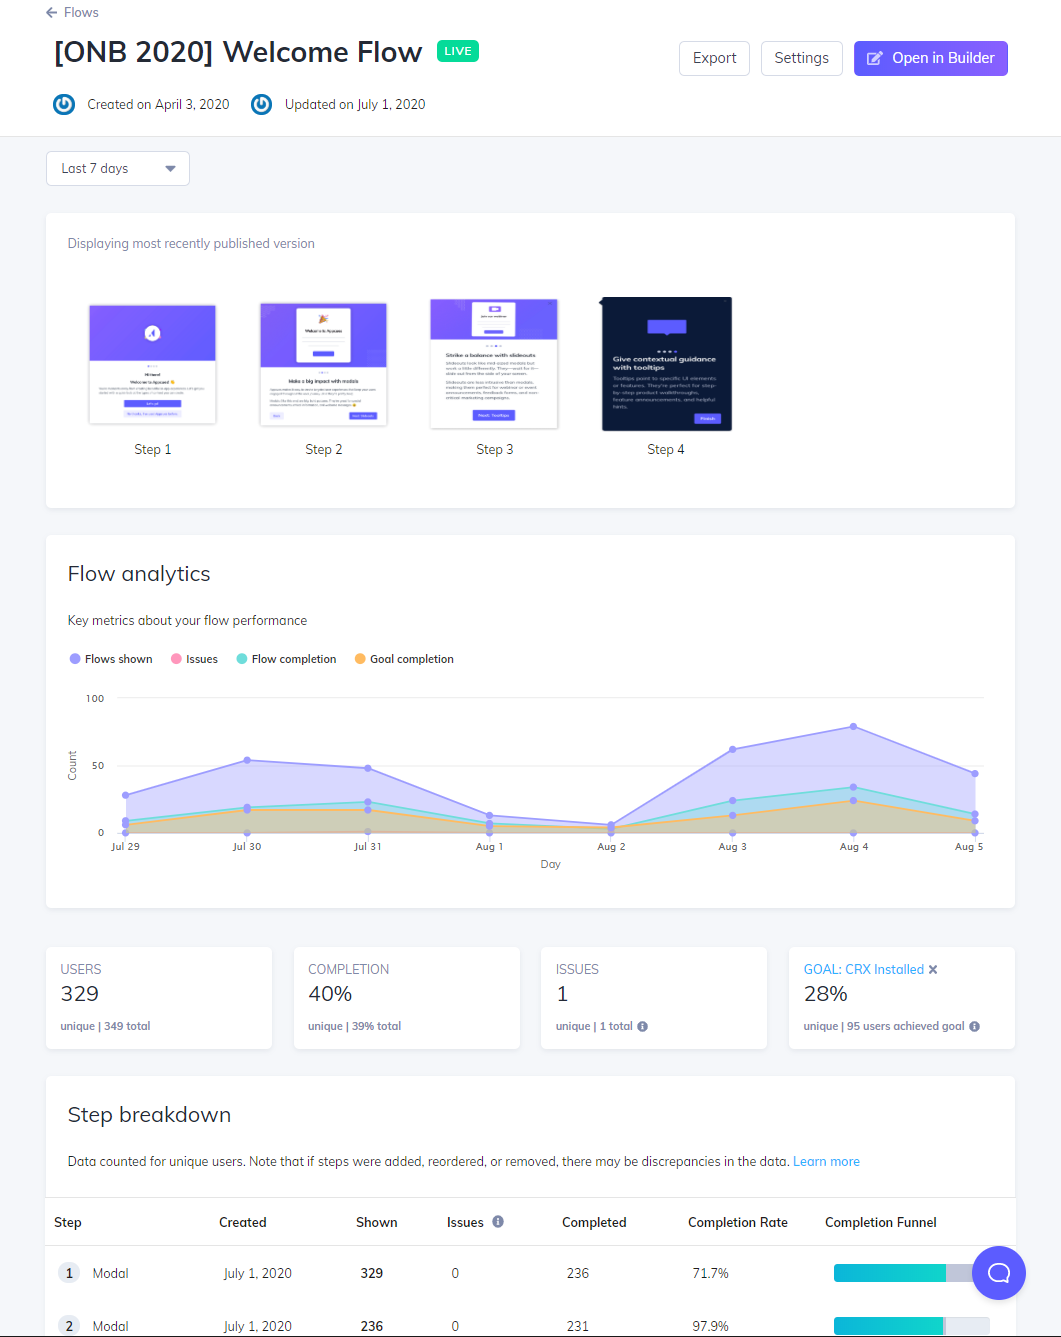
Here, you'll also have the ability to export your CSVs, continue to the flow settings, or be brought to the page to update your flow in the builder.
Additionally, you'll see a thumbnail rendering of your flow steps as well as the ability to change the time frame in which you're viewing the page. This allows you to view your data for a specific time frame, and applies to everything on the page.
Note: Stats will not display for flows that have never been published or ones that have not yet been seen.
The Chart
The Appcues chart gives you the ability to see how your flows perform over time to help you determine your flow's performance!
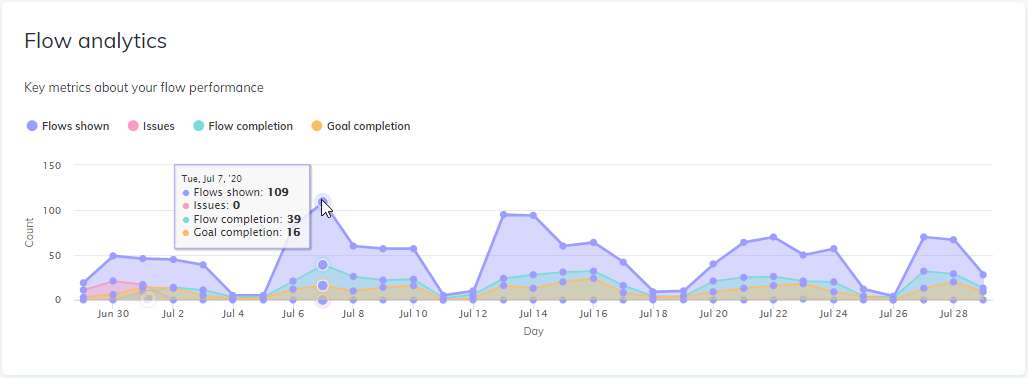
You can hover over particular data points to see all the stats related to the viewing and completion of your flow. The toggle-able legend allows you to view single, multiple, or all data points. It's important to note this data is charted by daily unique users. For example, if you have a user who sees a flow one time per day, for 3 consecutive days, then their 'view' will count towards each day's unique user count.
In addition, our chart also marks different versions of the flow. A version is defined when a change in the flow is made, published live, and then seen by a user. You can even see the change in issues if you updated any of your flows to help pinpoint what could be going wrong.
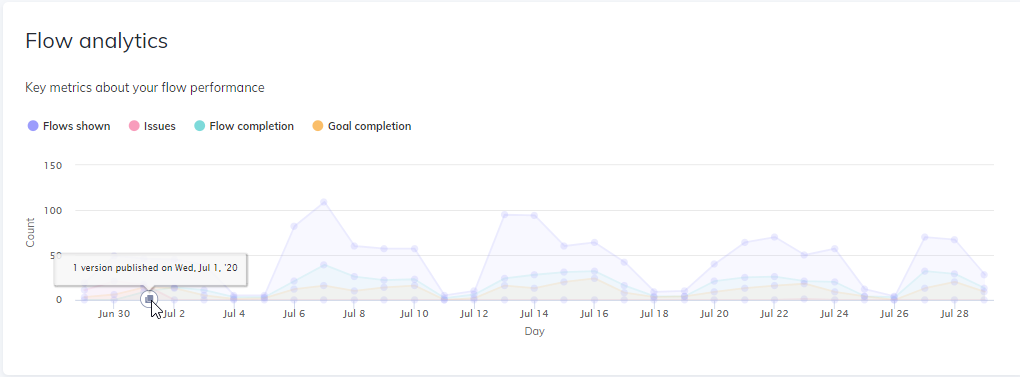
This hover will let you know the impact of your changes over time as you improve your flows and get even better results with your product and Appcues.
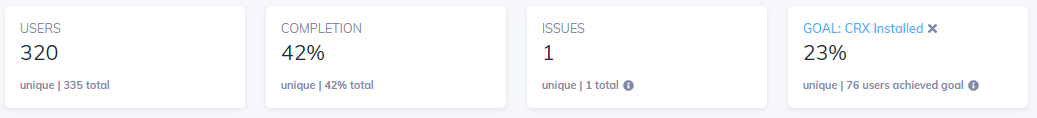
The Scoreboard
The Scoreboard allows you to see a data summary of the key metrics we track; Users Seen, Flow Completion, Issues, and Goals. Additionally, if you have a goal set for this flow, it's clickable and will bring you directly to the Goals page.
Step Breakdown
The Step Breakdown gives you an overview of your steps at an individual level within a flow. You can use this powerful tool to see where your users are dropping off, if there are any particular issues with the flow itself, or just see how successful you're being with these steps. You can see the date of creation of particular steps to see how adding a step has affected your flow.
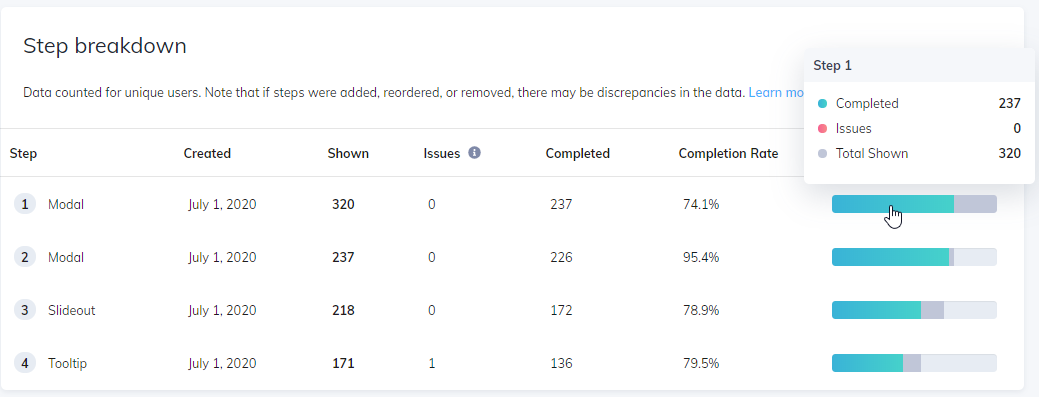
Note: If steps were added, reordered, or removed, there can be discrepancies in data. More information here: Step By Step Overview
Issues Report
The Issues Report section will let you know of the most recent issues your users may have experienced.
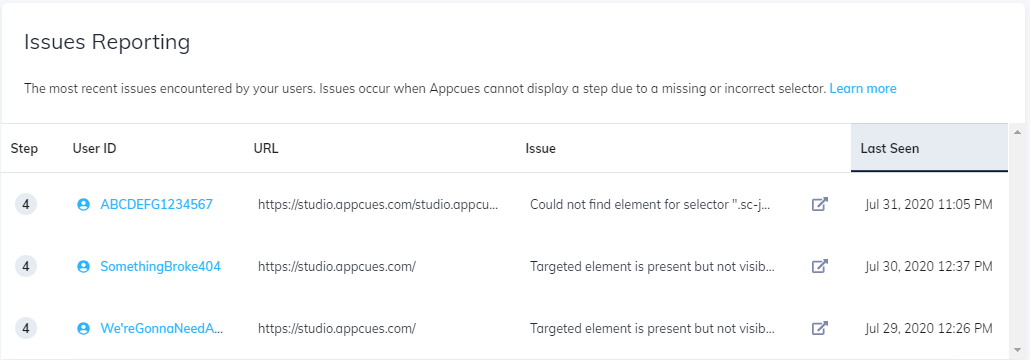
The table details the issues, the reason for the issue, the selector, and when the issue was last seen so you can fix if there are any recurring errors. From here, you can click to go to the Chrome extension builder to edit and fix any flows.
While the chart will show the 25 most recent events, you can find a full list of errors in the full CSV.
For additional details about this section check out our Issues Overview.
Most Recent Users
The Users section displays the 10 most recent users who saw the flow, along with the date and time they viewed it.
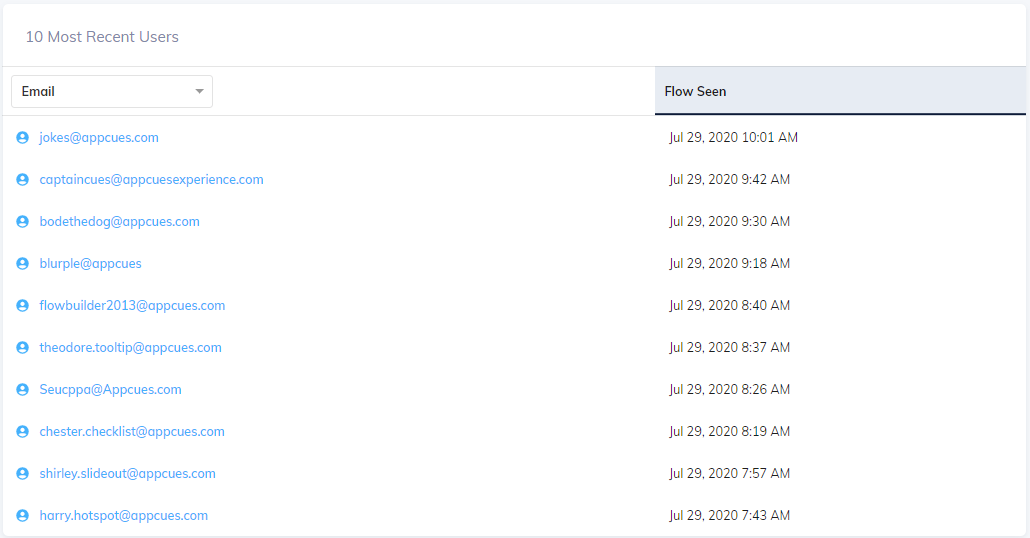
All of these users are clickable. When clicked, it will pull up their full user profile with all their attributes.
We hope you love our analytics page and it helps you on your path to success! If you have any further questions or requests about this page, please feel free to reach out to us at Support@Appcues.com!
There are even more ways to view Appcues Data!
We highly recommend integrating Appcues with your third-party tools analytics tools to evaluate Appcues KPIs with your own platform usage data. You can view a list of tools we integrate with here.