Installation Testing / Debugging
This article covers testing whether Appcues scripts are properly implemented on your application.

Written by Sofia Domingues
Updated at May 20th, 2025
Using the Appcues Debugger
The Appcues debugger is our most straightforward troubleshooting feature. It allows you to quickly spot the root of a problem, so you can get things working again fast.
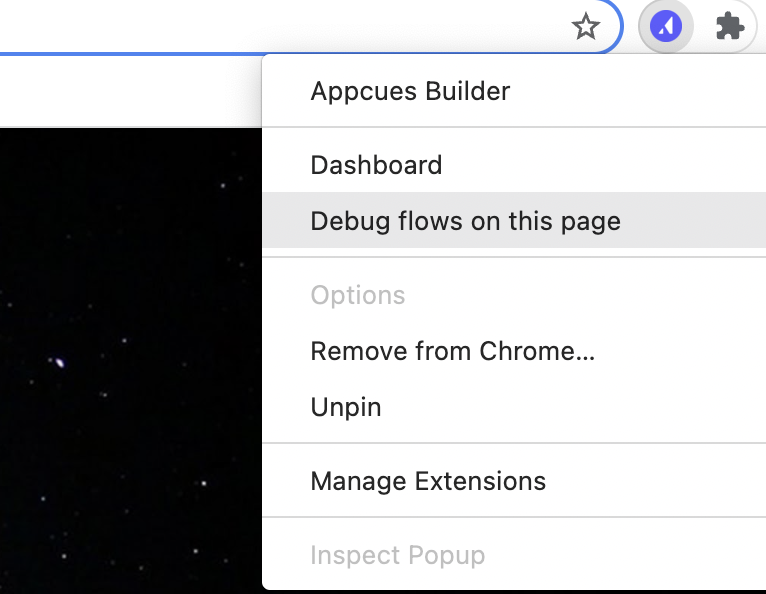
Opening the debugger from the Chrome Extension
If you're on the URL where your flow(s) should be showing, and you've already downloaded the Chrome extension, you can right-click the Appcues Chrome Extension icon and choose “Debug flows on this page...”
Please note: The debugger will not show the correct results if the builder is open. If the builder does get accidentally opened, not to worry. Simply close the browser window, navigate to the URL where the flow should show in a new window, and try the steps above again.
Opening the debugger from the console
Call Appcues.debug() in your browser's javascript console, our personal favorite method (see below for details). The Appcues status box below will stay on throughout your session until you close the panel.
Right-click anywhere on the page and select 'Inspect'. Select the 'Console' tab and call Appcues.debug()
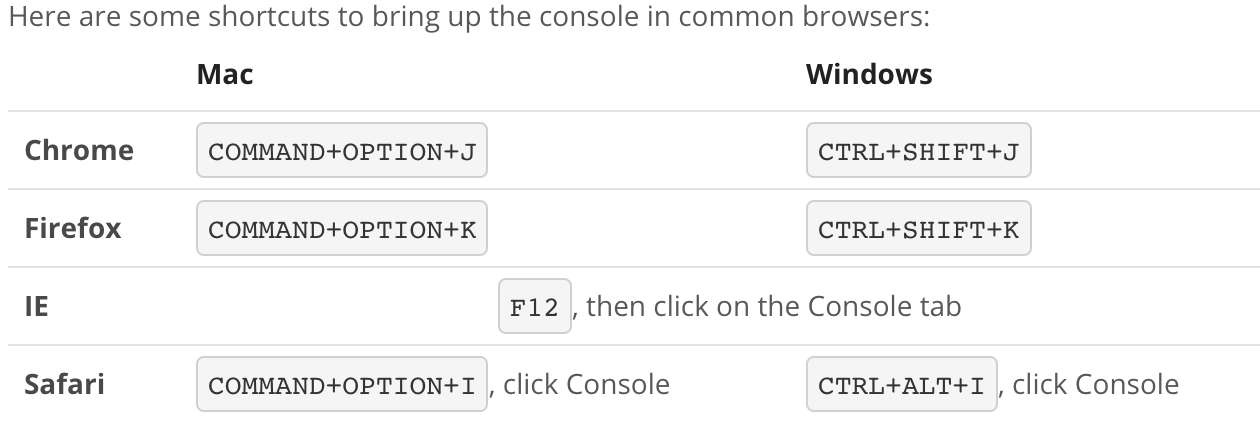
You can also open your console using the appropriate shortcut below.
Once your console is open, you'll enter in Appcues.debug() in the open spot and hit enter to bring up the debugger.
Note: you may need to scroll down the bottom of the console log to see the space to enter the call

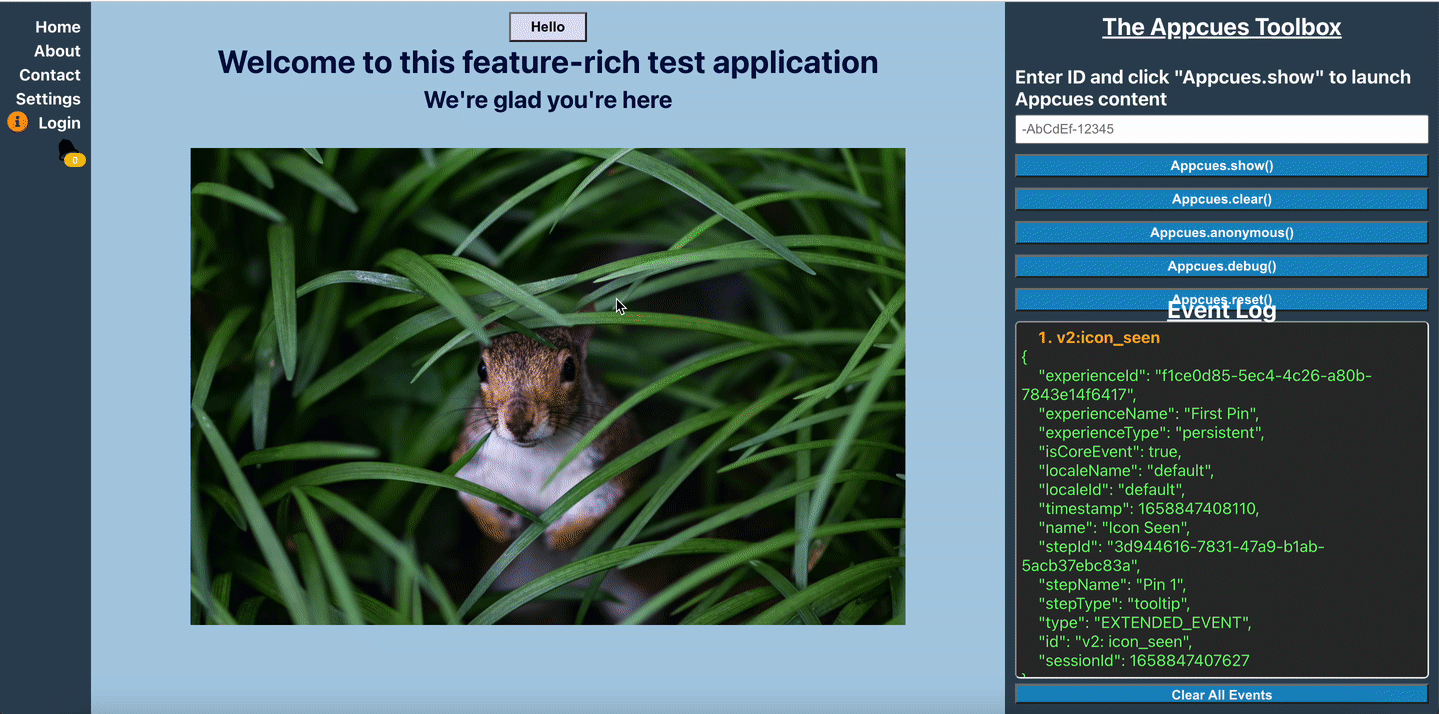
Now that you've got it up you can also use it to Get to the Flow Diagnostics.
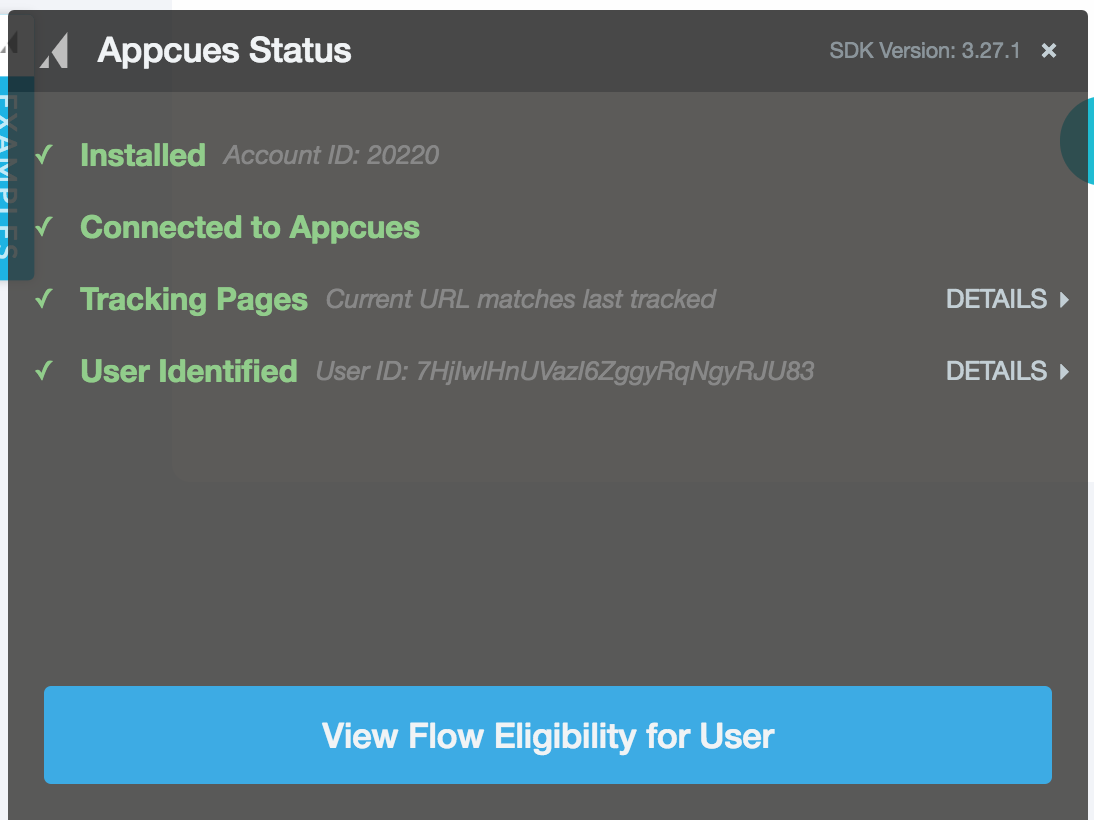
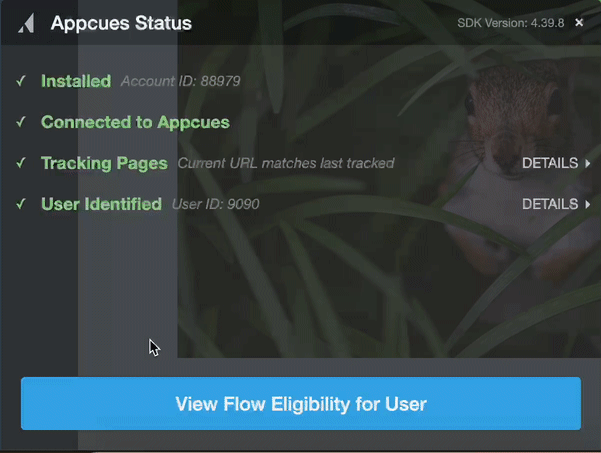
Is Appcues installed on the current page?
The easiest test is to try Opening the Appcues Debugger.
If you can't open the debugger you're likely not installed or something is blocking Appcues (you should see errors in the console if that's the case). See the Installation Overview on how to install or send an email to support@appcues.com if you have already tried installing.
Are page changes being tracked?
As you navigate through your app, the debugger will watch for URL changes and show whether Appcues has checked each one. If the URL changes without Appcues being re-initialized, it will show the last URL that was checked.
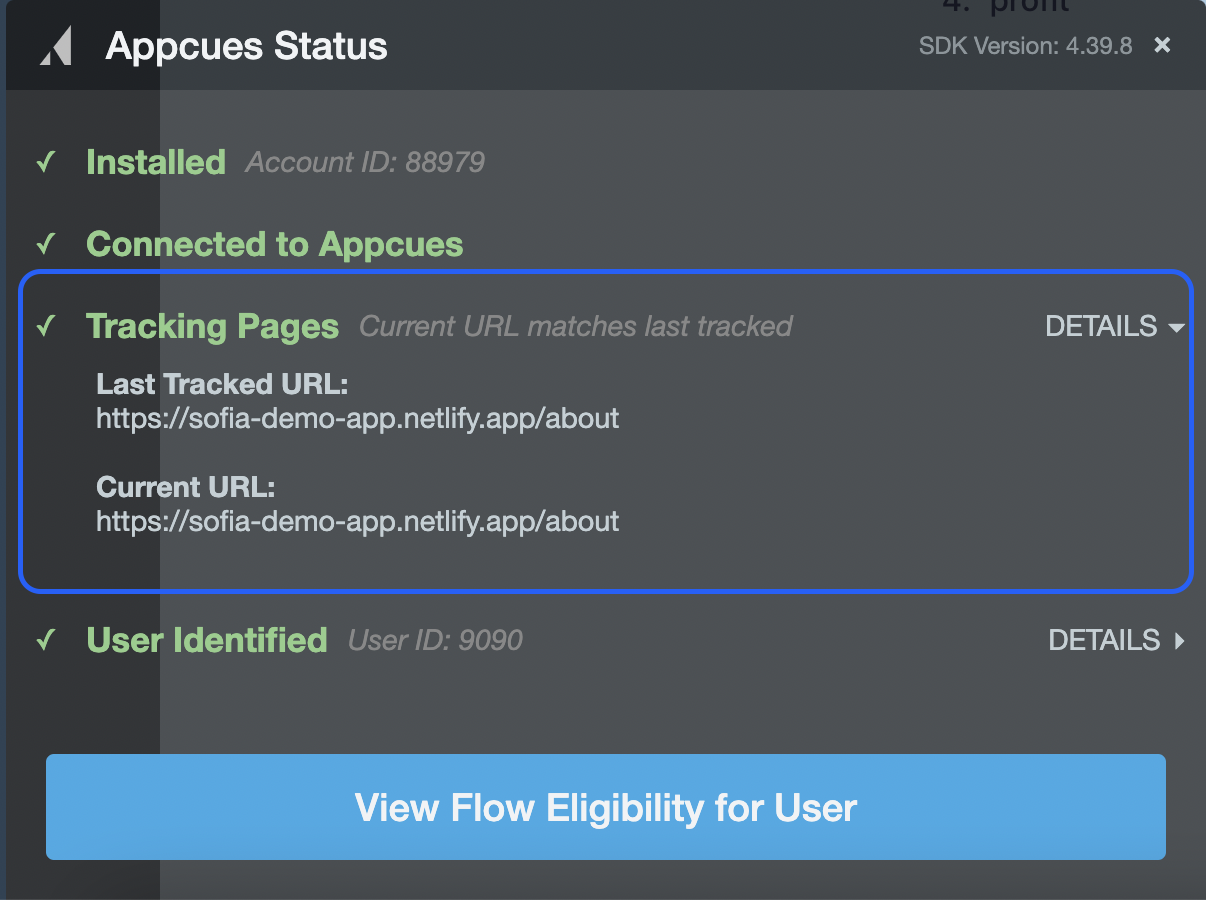
To check that things are working, navigate through your app or refresh your page. If the red error X next to "Last Tracked URL" persists, Appcues is not tracking page changes. This could signal an issue with the Appcues.page() call. Select your platform type here to learn how you can install this call.
ProTip: Publish a flow to just your user_ID, targeting the page you're on and see if the flow shows automatically. If you need to refresh the page in order for Appcues to appear, that indicates the Appcues.page call is in the wrong place.
Are users being identified?
You can see if the user has been identified during the current visit and how many properties were passed in the identify call. If the user properties are being sent correctly you will see a green ✔️.
Appcues implementation best practice:
Ensure that your Appcues.identify(); is called prior to the execution of the first page() call within your Appcues implementation code.
If not implemented this way, your end users could experience a delay due to events buffering while waiting on a user to be identified.
You'll also see your User ID right next to User Identified, as shown below.
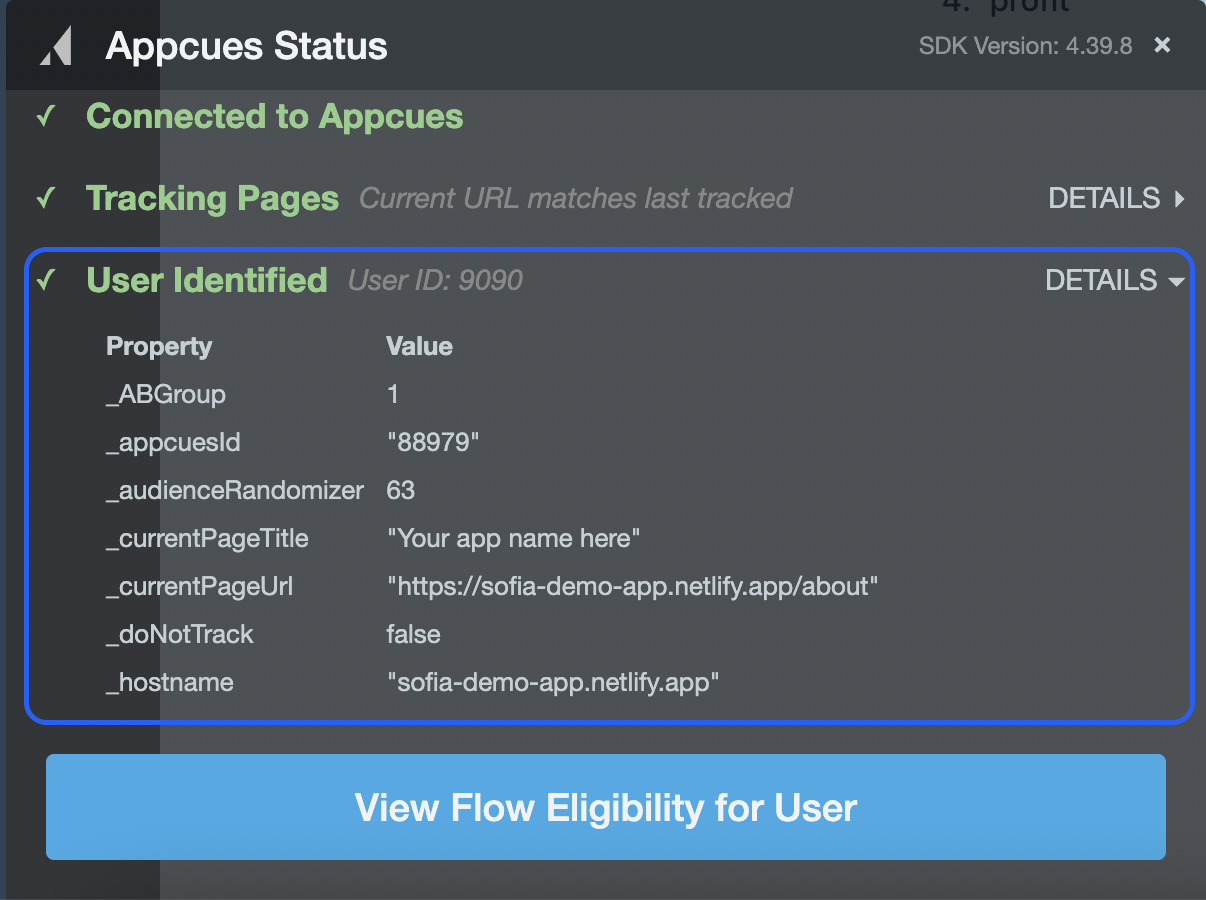
Clicking on "Details" will show all user properties that were sent at the moment for that user. A red X next to "User Identification" means that we cannot recognize a user on your page. If this is the case, you'll need to add either the Appcues.identify(), Appcues.anonymous() or both calls to your installation. Learn more about the Appcues.identify() call here.
If you have Appcues installed via Segment, you'll want to make sure Segment's analytics.identify() call is being called on this page so Appcues can recognize your individual users. Learn more about Segment's identify call here.
What User Properties are being sent to Appcues?
In the same section as "User Identified" (covered above), you can scroll through all user properties for the specific user (probably you) that is logged into that page at the moment.
A full set of User Properties is available on the Events and Properties page in Settings.
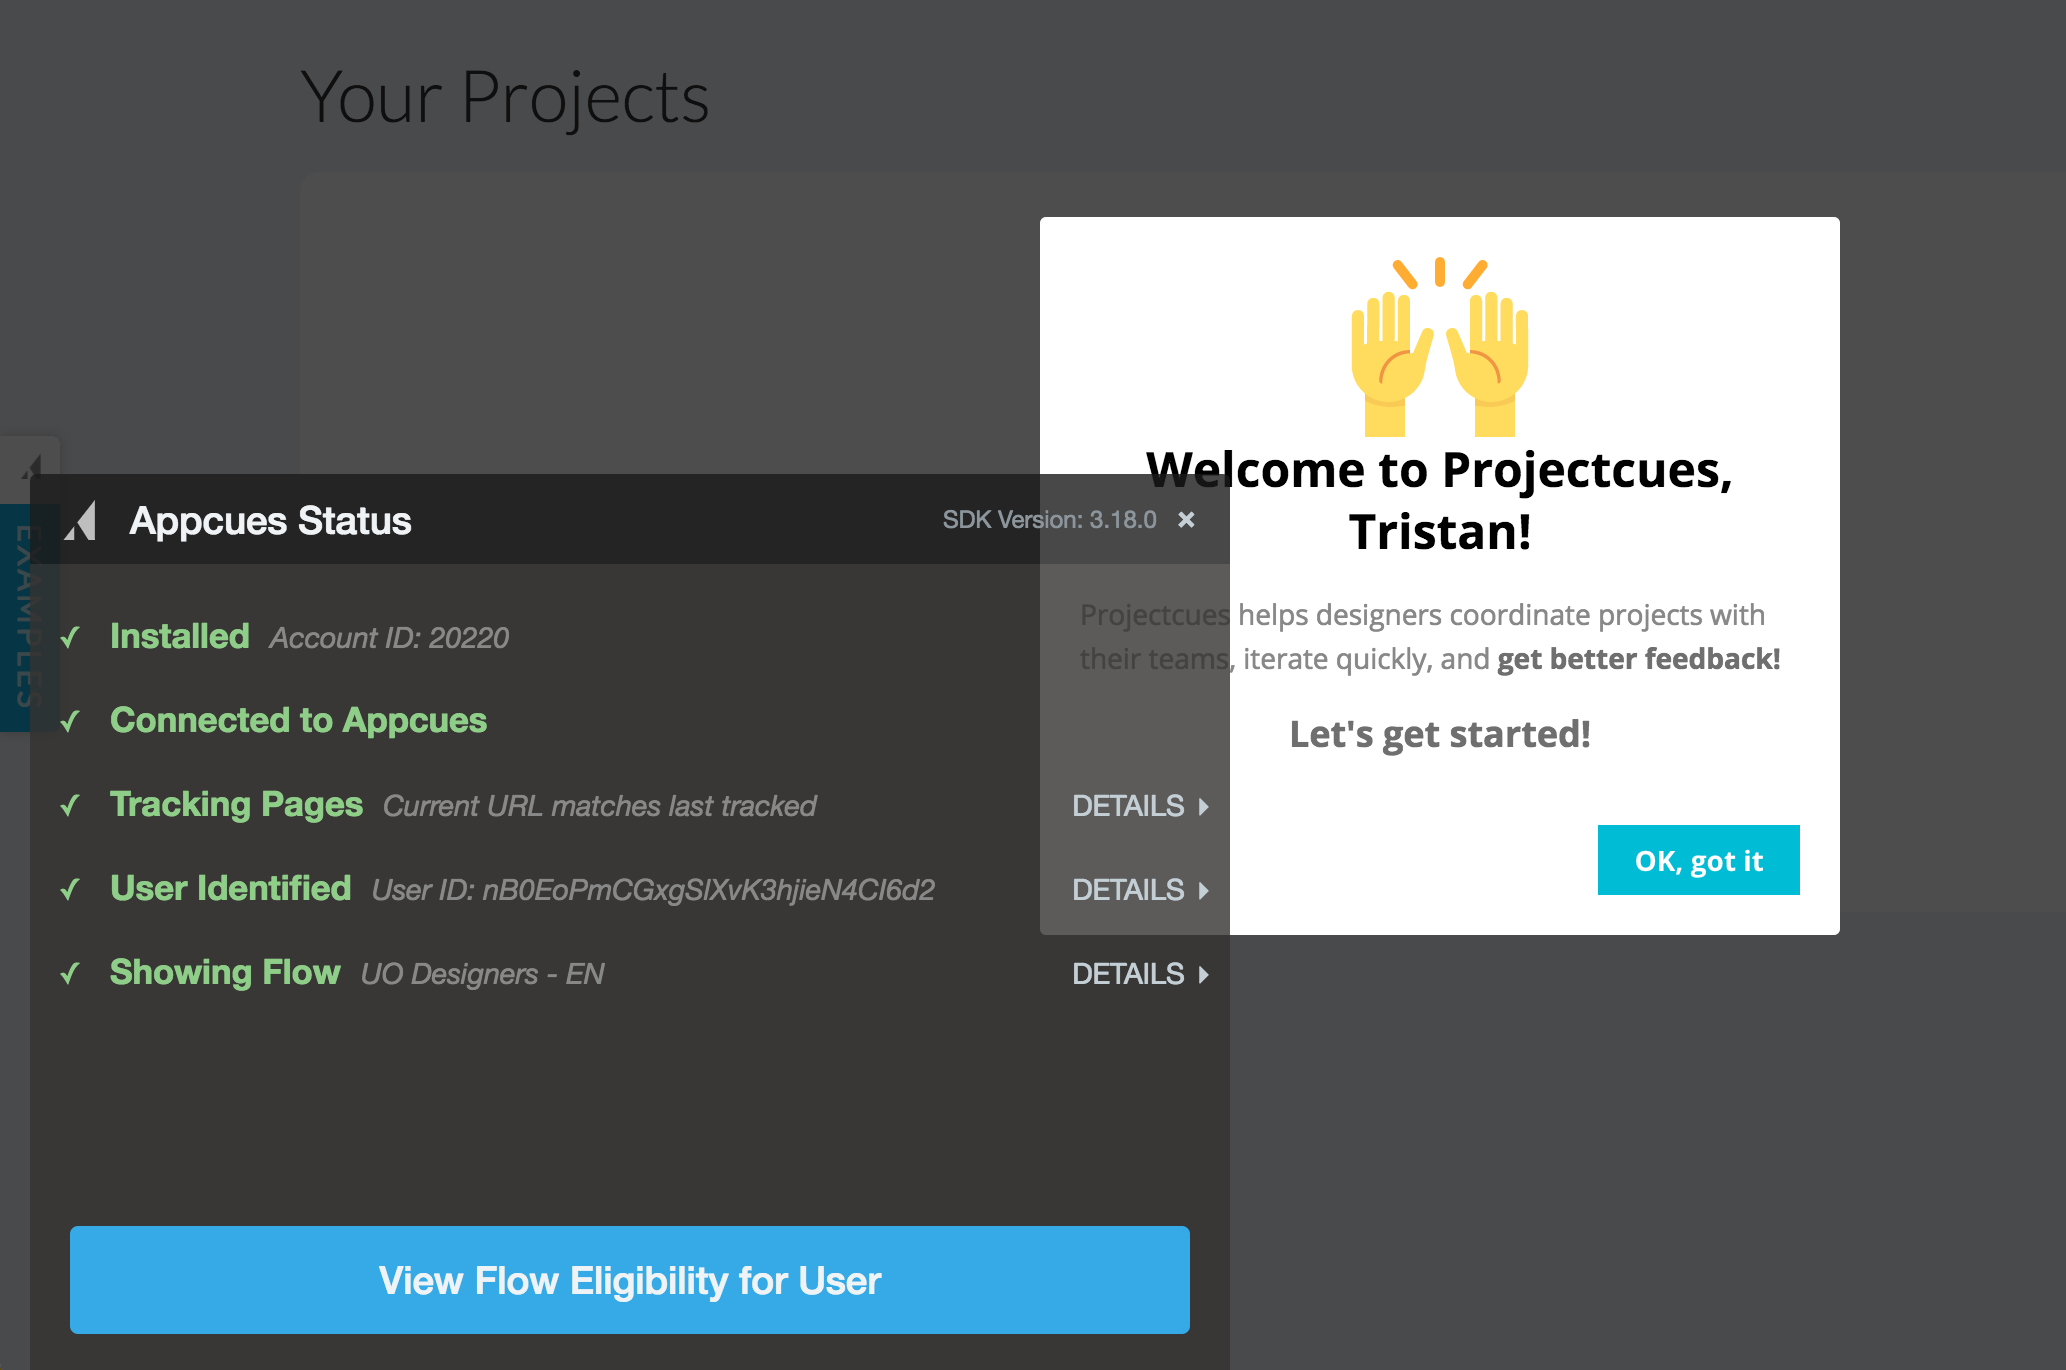
Why is/isn't a flow showing?
If a flow is showing, you will see the name of the flow along with and give you details about the group and step. If you're having issues with a flow not showing, check out our documentation Why isn't my flow showing? If you're having issues with a step that isn't showing, check out our documentation Why isn't a step showing?
What if I'm running into an Ad Blocker?
If you're running into issues with ad blockers, consider hosting the Appcues SDK under your own domain (you may need developer's help for this).
FAQ
- Is it possible to reposition the debugger?
Yes! You can input this function in your console to reposition the debugger:
(function() { const {style} = document.querySelector('appcues-debugger'); style.left = '40%'; style.bottom = '25%'; })();
Still stuck?
Write to us at support@appcues.com and we'll be happy to help! For the quickest support, please be sure to provide your flow name, a demo login for your site (we'll need to access your targeted page), and any troubleshooting details you might have for us.