Studio Events Explorer
Analytics, charts, and reports all with Appcues Studio

Written by Sofia Domingues
Updated at June 11th, 2025
Event Analytics brings together product event data along with Appcues Flow and Checklist data for a dynamic reporting experience. This enables both monitoring an event over time to define adoption baselines, as well as the measuring of product event data against Appcues Flow and Checklist data to prove the impact of in-product experiences.
Events Explorer
The Events Explorer allows you to visualize the events that occur within your product, monitor them over time, and gather insights about usage.
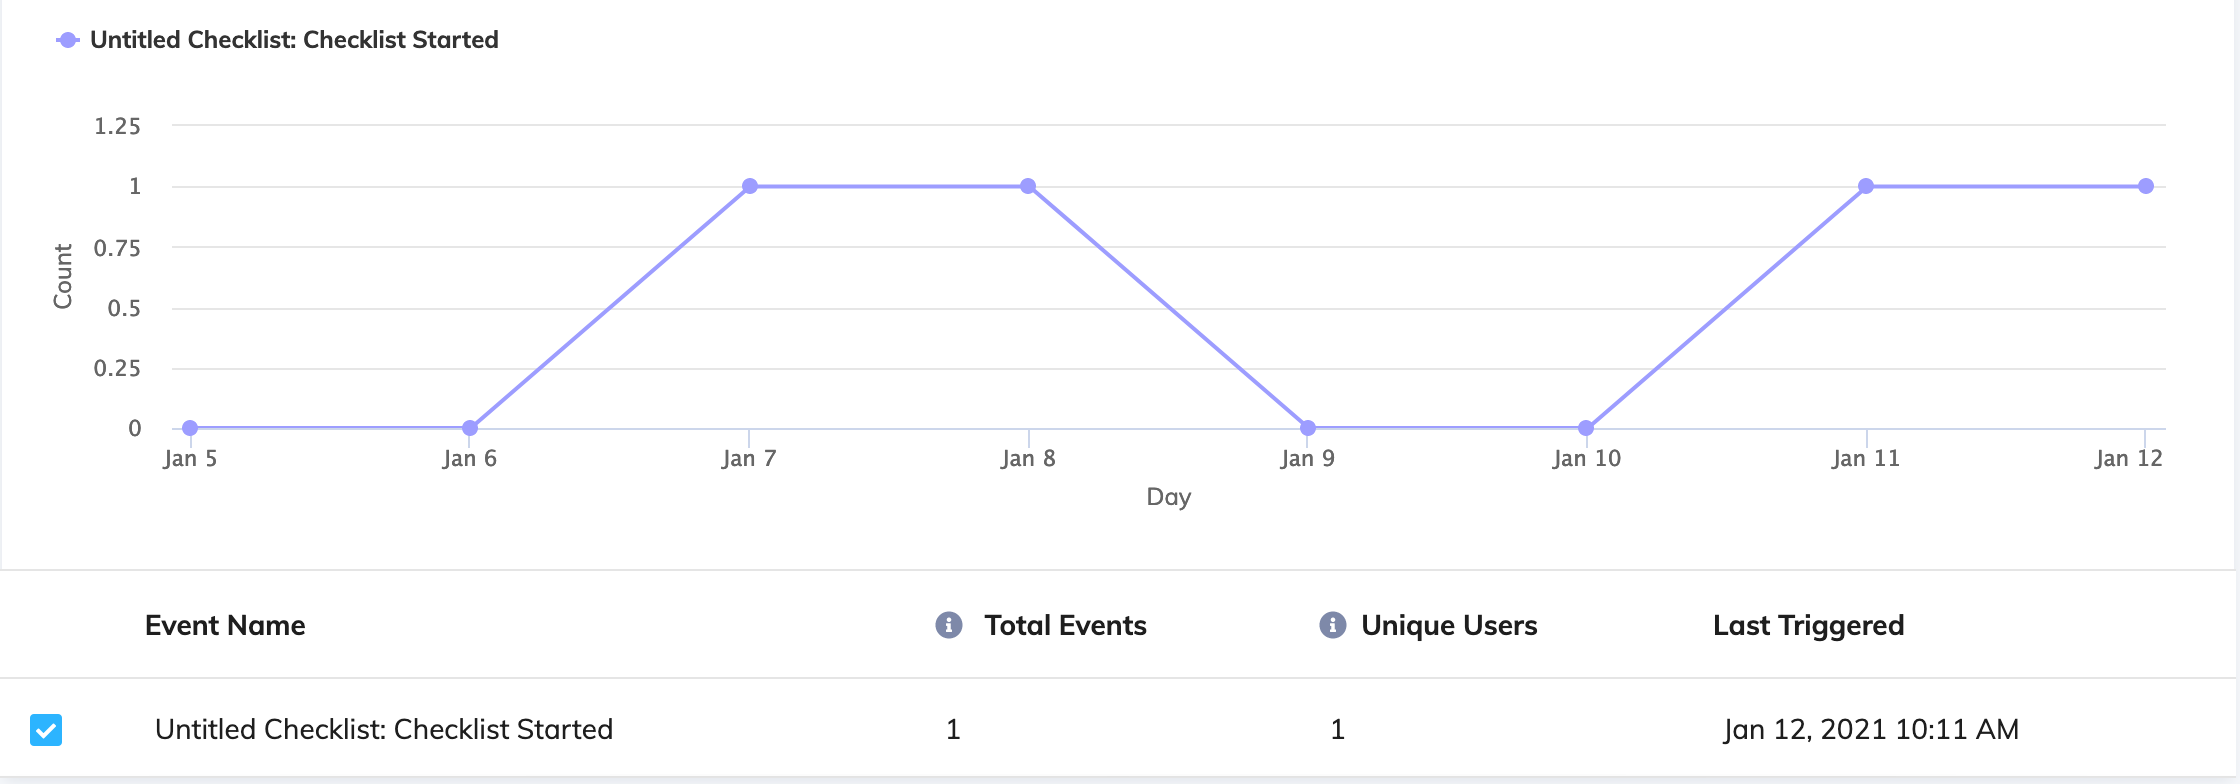
Overview Chart
The Overview chart displays an at-a-glance view of your event stream, broken down by:
- Total Events: The total number of times an event has been received.
- Unique Users: The number of times an event has been received by unique users.
- % of Users: The number of unique users who fired the event compared to the daily active users for the period of time.
Once specific events are added to the chart, you can toggle between a line chart or bar chart to better understand the data.
Filters
At the top of the page, you have the option to filter the data displayed by timeframe, so you can view data for the last 7, 30, 60, or 90 days. You can also filter by User Segment to view data for only a subset of your user base. CSV exports will not take into account segment filters.
Note: When filtering by User Segment, Appcues will filter based on users who were in that segment during the selected time range. This means you may see different users and data for a given day depending on the time range. For example, if you have a user who was part of a segment at the beginning of January but left that segment on January 20th, they would appear in a search for January 1–January 15, but they would be left out of the results entirely in the results for January 1–January 31.
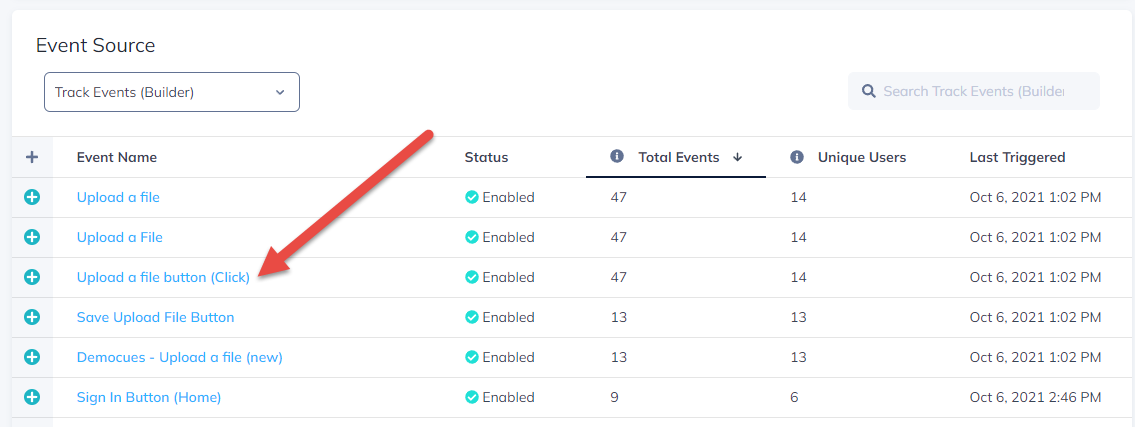
Event Source Table
There are four event types that are included in the Events Explorer, all of which can be toggled between.
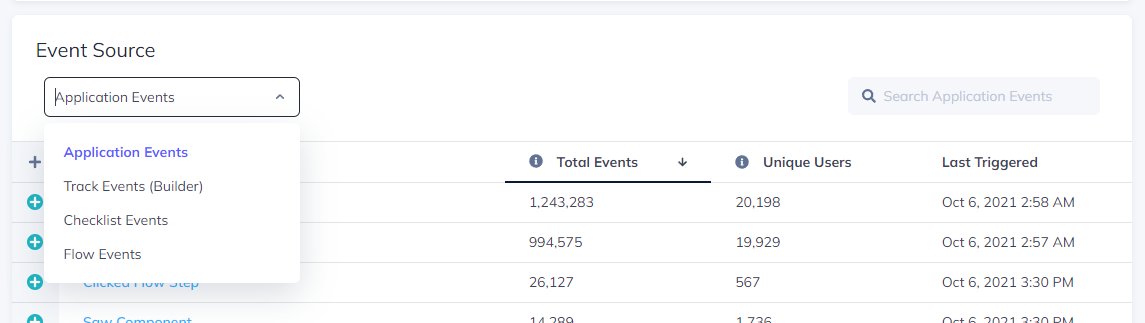
- Application Events: user events that your application sends to Appcues via our SDK, Segment, or our server-side API, which utilizes our Appcues.track() call. This is not to be confused with click-to-track events.
- Track Events (Builder): click-to-track events you create in the Builder to track clicks on a specific element.
- Checklist Events: events that occur during a user's interaction with a checklist, such as checklist started and checklist completed.
- Flow Events: events that occur during a user's interaction with a flow such as flow started, flow completed, and issue events.
For each event, you will see the following data points:
- Event Name: The name of the event received.
- Total Events: The number of total event occurrences.
- Unique Events: The number of unique users who triggered the event.
- Last Triggered: The timestamp of the last time the event was received by Appcues.
Checklist Events
Within the Checklist Events category, you will find each checklist has an expandable line which reveals all of the sub-events for that checklist.
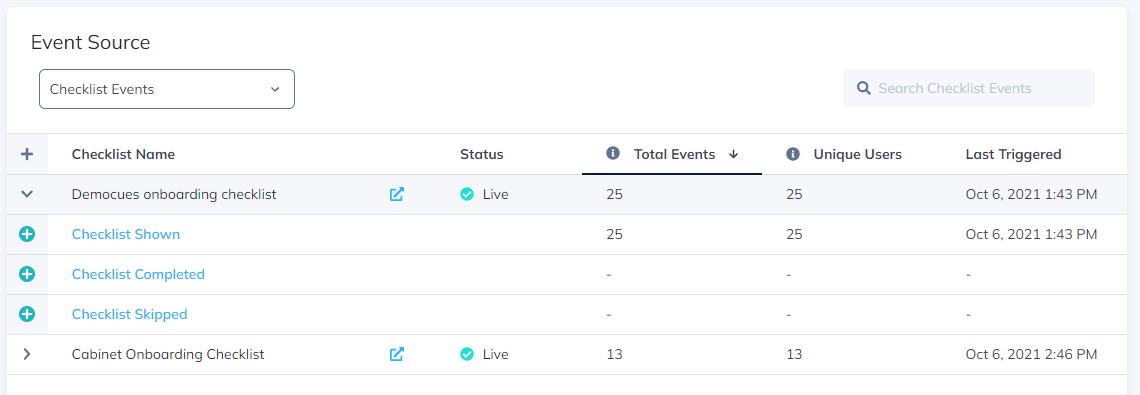
- Checklist Shown: Number of times users have seen the checklist.
- Checklist Completed: Number of times users have fully completed the checklist.
Note: Total and Unique counts for checklists will always be the same because it is a persistent pattern.
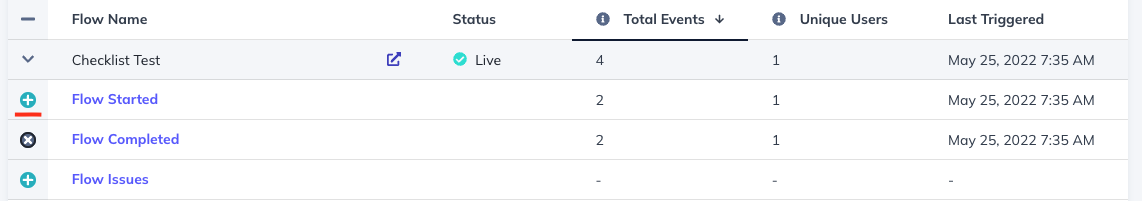
Flow Events
Within the Flow Events category, you will find each flow has an expandable line which reveals all of the sub-events for that flow.
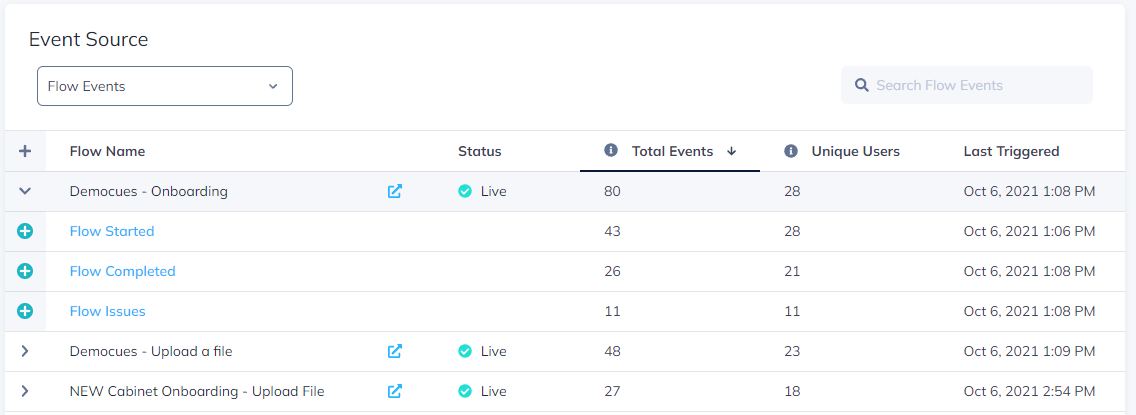
- Flow Started: Number of times a user sees the first step in the flow.
- Flow Completed: Number of times a user proceeds through every step of a flow and clicks close on the final step.
- Flow Issues: Number of times an issue occurred which caused a flow to stop showing. Learn more.
Search
You can search for events using the search bar on the top right of the Event Source table. Search is not case sensitive and will apply to the specific event category you are viewing; it does not search across all event types.
Adding events for analysis
You can toggle between the different event types to view your events, select multiple events, and add them to the overview graph for analysis. There is a maximum of 4 events that can be added at any one time.
Use cases to get started
- Add a few Application events to the overview graph to get a quick insight into engagement with those events.
- Add your Track events to the graph to see how your users are interacting with your product.
- Had a feature release recently? Add the flow you used to launch it and the (application or track) event tracking the click to see how the flow influenced engagement.
- Add one of your onboarding flows as well as key events that lead to activation (Application/Track events) to see how the flow may be impacting behavior.
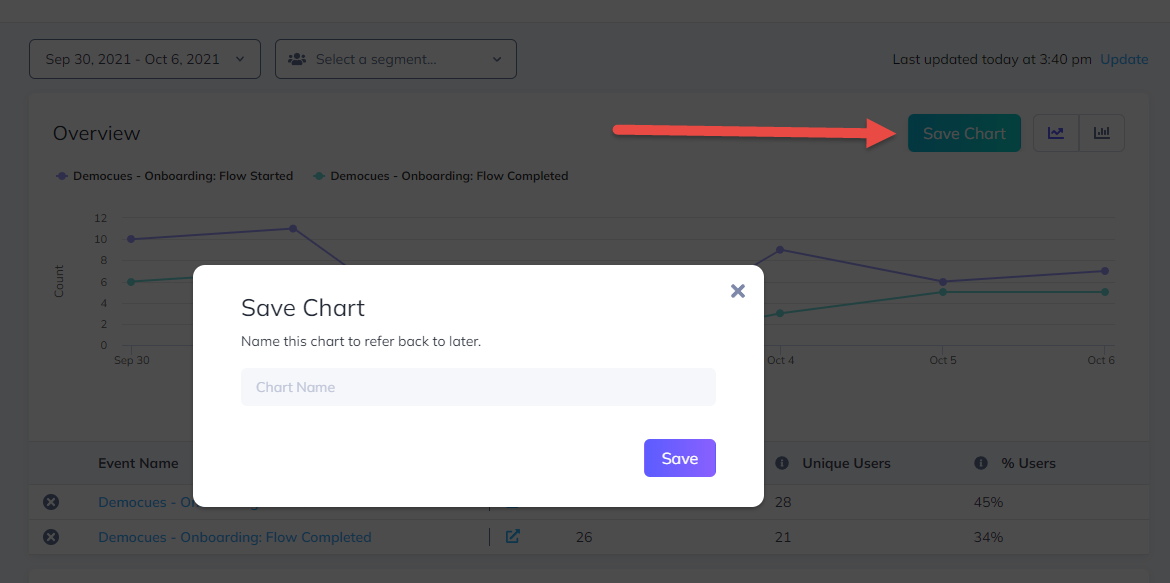
Saving a Chart
While exploring your events you can add events to your chart by clicking on the Add Symbol next to the event details.
After you've added an event to the Overview chart, you will have the ability to save that chart. The Events Explorer will save the events selected, time period, user segment (if applicable), and chart type; however, you can change these at any time on the chart's detail page.
After you have saved one or more charts your Dashboard will now be populated we will also include a search function for quick reference.
Single Event Detail Page
If you'd like to dig into your data a little more before saving a chart, simply click on any event name to visit the single event's detail page.
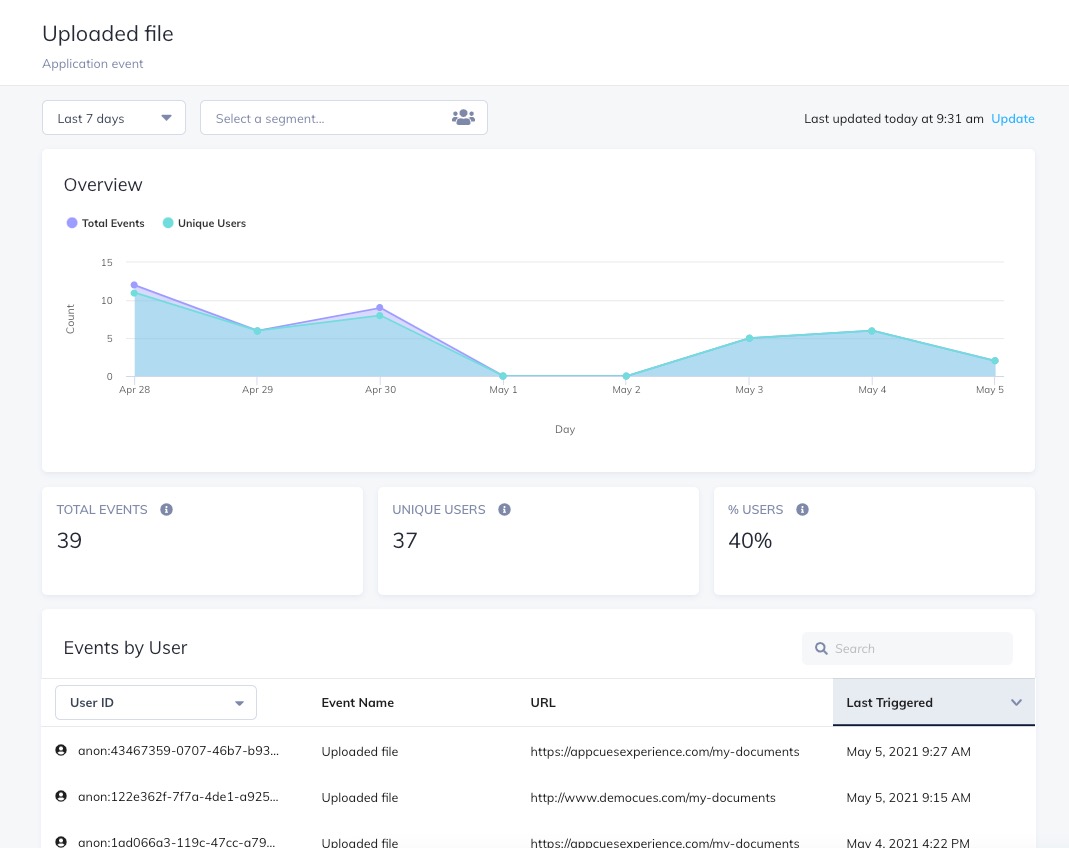
Detail Page
The detail page allows you to better understand the overall engagement for any event that is available in the Events Explorer. The Overview graph displays both total events and unique users, so you can get a sense of overall and unique usage. The Events by User table includes a searchable list of all users who fired the event.
Saved Chart Metric Page
Once you've saved a chart, you can refer back to it at anytime via the Dashboard or the chart's unique URL.
Overview Chart
The Overview chart displays an at-a-glance view of your selected events, broken down by:
- Total Events: The total number times an event has been received.
- Unique Users: The number of times an event has been received by unique users.
- % of Users: The number of unique users who fired the event / daily active users for the period of time.
Events
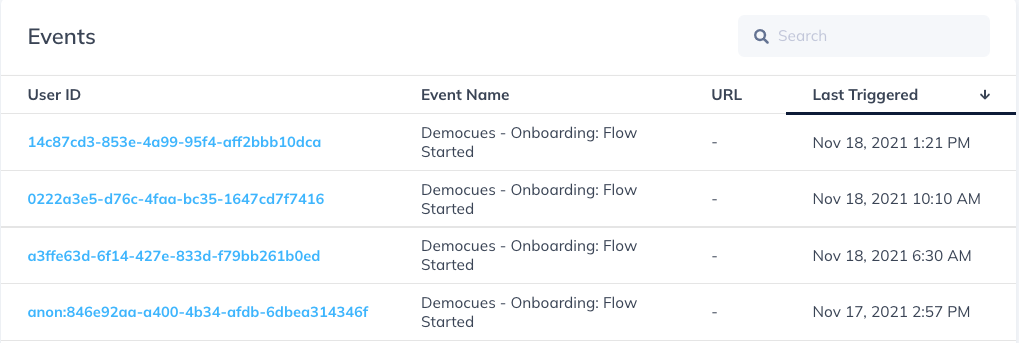
The user list displays a stream of the total events broken out by individual user. Within the table, you can see the user ID, view the URL where the event occurred, and the timestamp from when it was last triggered.
If you have multiple events selected in your chart and a single user has fired one of each, or if a user has fired the same event multiple times, there will be a line for each of those occurrences.
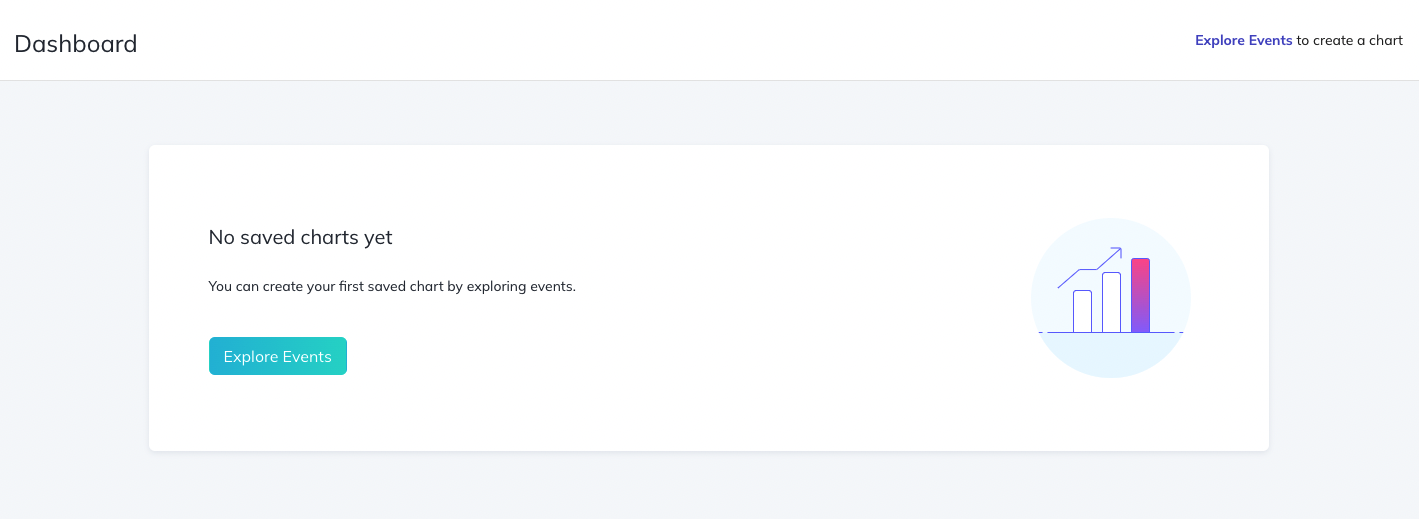
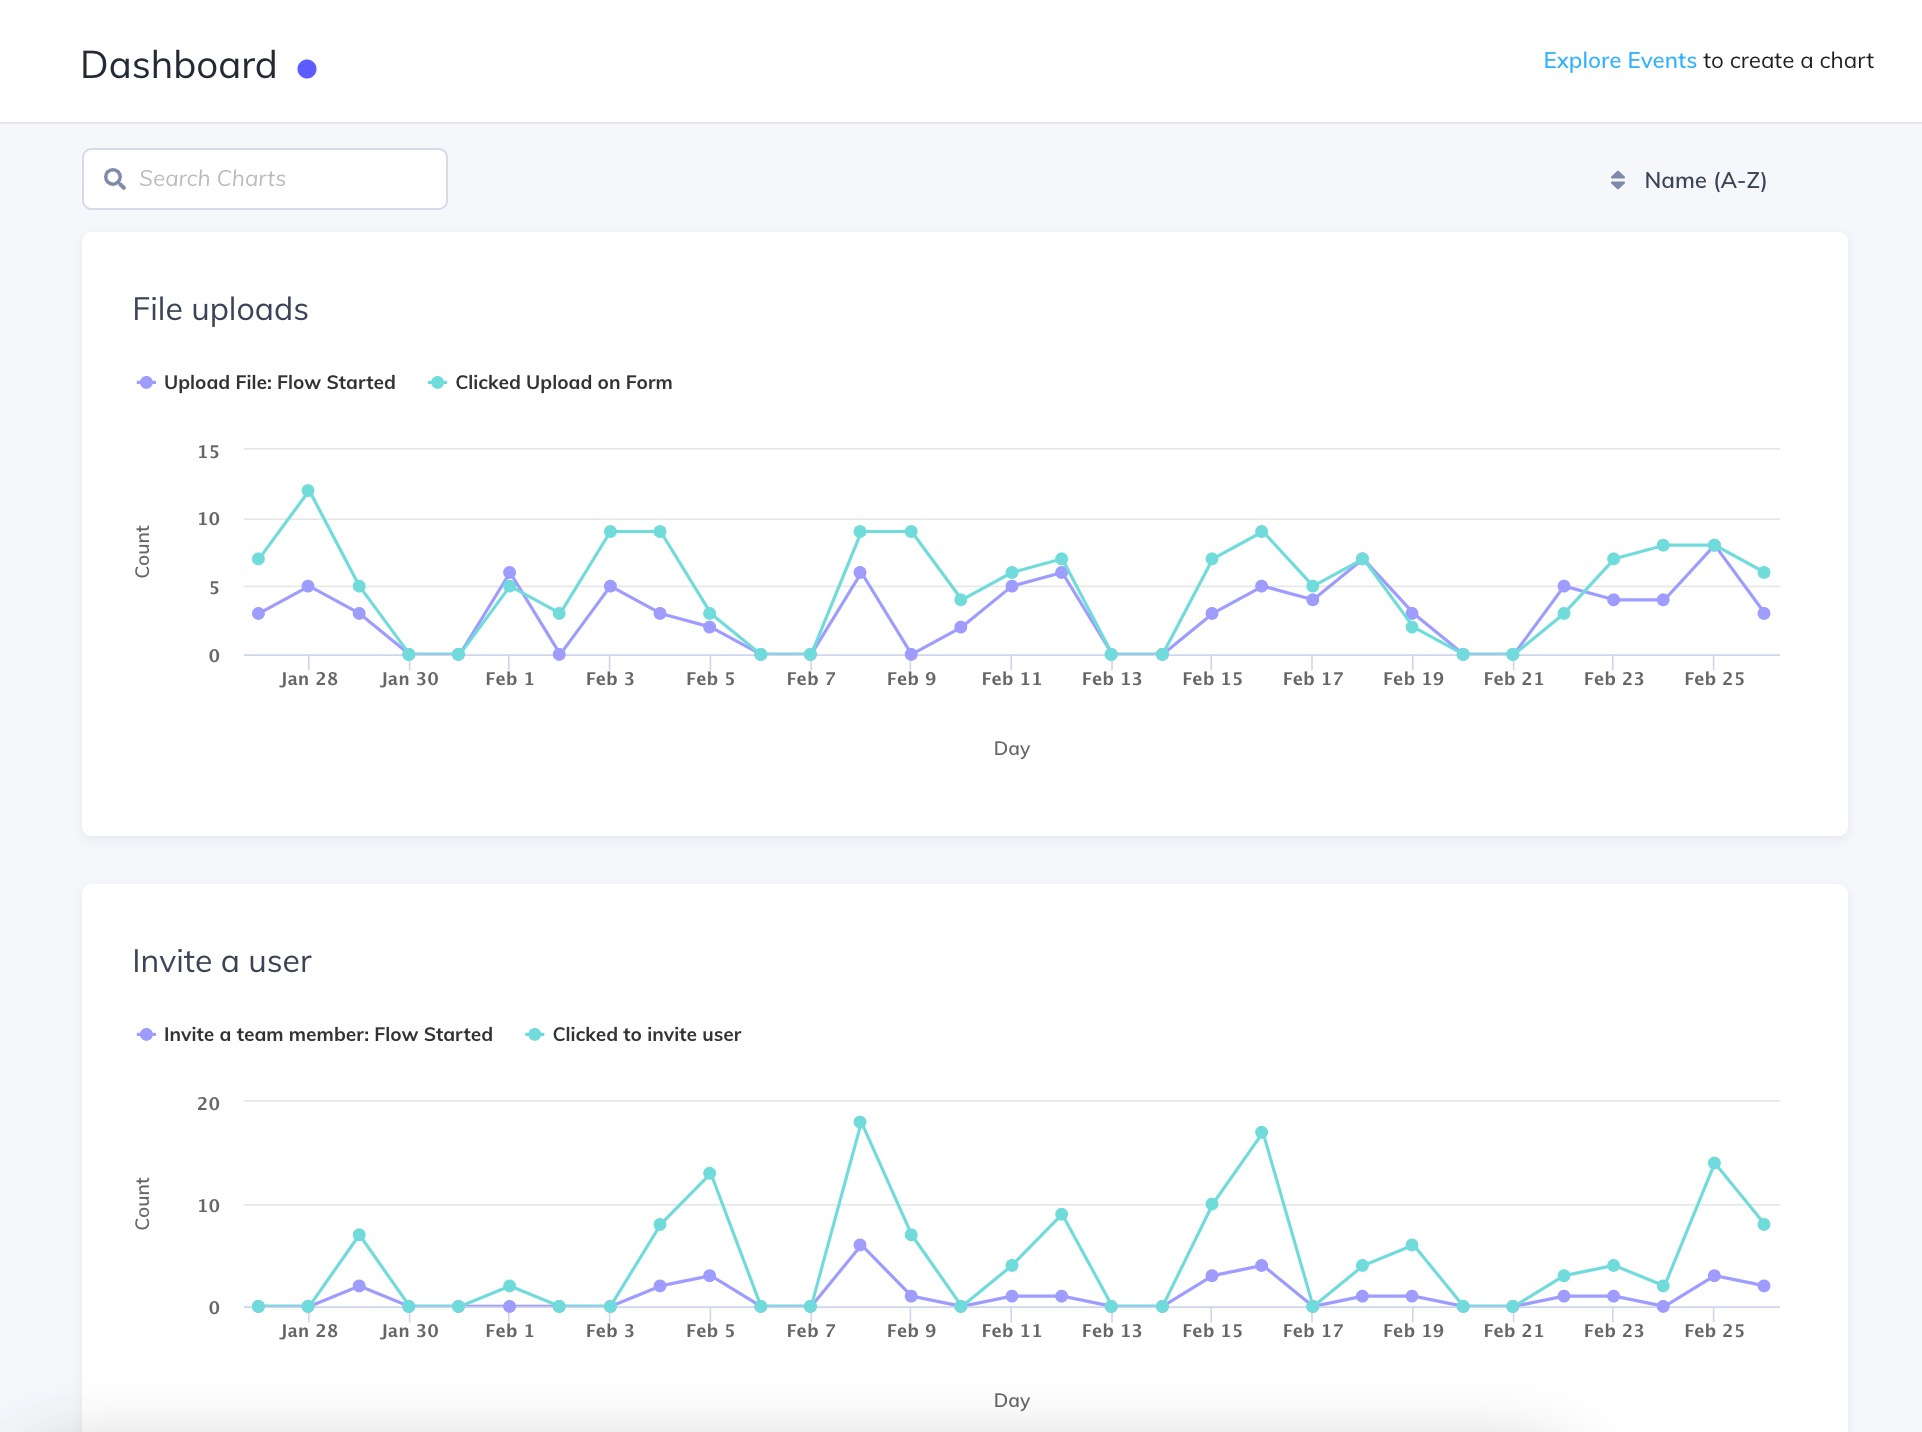
Dashboard
The Dashboard is where you will find all of your saved charts to refer back to at any time. Here you can search, delete, or click into a specific chart for more details.
Want to dig in deeper?
If you're ready to dive into deeper analysis, Appcues partners with a number of analytics tools:
- Google Analytics
- Amplitude (Two-Way Integration)
- Mixpanel (Two-Way Integration)
- Heap (Two-Way Integration)
- Kissmetrics
FAQ
- I created an event using a custom button in the Builder. Where can I see the data of this event?
Events created with custom buttons will show up under Application Events. However, it's important to note that an event needs to be triggered live before it will appear in the events explorer, and it may take around 30 minutes before it's visible.
- Why does checklist data in the table not correlate with the data charted on the graph?
Appcues considers the number of unique users who view a checklist to be the total number of views. The data shown in the Event Source table will display those unique counts, but the chart will display each user who saw the checklist on a certain day. For example, if a user saw the checklist on 5/7 days in a given week, the table will display 1 total event, but the user will appear 5 times on the chart (once for each of the 5 days they saw the checklist).
- How does User Segment filtering apply to historical data?
When filtering by User Segment, Appcues will filter based off users currently in that segment. For instance, if you have a segment for `role` = `designer`, the Events Explorer will report on the current "designer" users who have fired the event over X period of time. If a user's role does not equal designer (either it never was or it has changed), then they are excluded from the report.
- Why am I seeing lower than expected engagement when filtering by User Segment?
If you are seeing lower than expected engagement when filtering by Segment, it may be a result of how data is tracked for newly created or edited Segments. After a Segment is created (or edited), event analytics filtered by that Segment will initially only show users that were in the Segment for the last 7 days.
When you apply a newly created Segment to the Events Explorer and view a report for 90 days of data, Appcues will take users who were in the Segment and active in your application in the last 7 days, and look back at 90 days of event data to see who in that 7 day list achieved the event. As your segment matures in age and more of these segment users are identified by Appcues post-segment creation, this gap in date coverage will close. For example, if a User Segment is 23 days old and you look at a report for 30 days of event data, you will have full coverage for the time period selected (7 days of trailing data + 23 days of active tracking data = 30 days of historic data).
- Do you have a public API to export Event Data?
Yes, certain events can be exported via our Public API.